Table Of Contents
Introduction
Monitoring is an essential aspect of any production application. It helps you track the health, performance, and reliability of your application in real-time. In this article, we will walk through how to set up monitoring for a Laravel application using Node Exporter, Blackbox Exporter, Prometheus, Grafana, and Alertmanager.
With this setup, you will be able to monitor both your server metrics (like CPU, memory usage, etc.) and your application’s HTTP endpoints, visualize the data using Grafana dashboards, and set up alerting for issues like downtime or resource exhaustion.
Application Monitoring Setup
Prerequisites
- Docker and Docker Compose installed on your local machine.
- A Laravel application running on local development using docker.
- Git installed on local machine.
Why This Stack?
- Prometheus: An open-source systems monitoring and alerting toolkit. It collects metrics from configured targets at given intervals.
- Node Exporter: Exposes hardware and operating system metrics, such as CPU usage, memory, and disk space.
- Blackbox Exporter: Probes external endpoints to monitor their availability and performance.
- Grafana: A visualization tool to display data from Prometheus in user-friendly dashboards.
- Alertmanager: Sends alerts based on the conditions defined in Prometheus, allowing you to receive notifications in email, Slack, etc.
Code Setup
All the code for this demo is available in the Github code repository here. Clone the repository by using below command.
  # clone git repository
  git clone https://github.com/ReddyPrashanth/laravel-monitoring.git
  cd laravel-monitoring
Docker Compose Setup
To make the setup easier, we will use Docker Compose to run all our services (Prometheus, Node Exporter, Blackbox Exporter, Grafana, and Alertmanager). Our demo code contains a docker-compose.yml file with the following content:
    x-app-environment: &appEnvironment
        APP_NAME: ${APP_NAME}
        APP_URL: ${APP_URL}
        APP_KEY: ${APP_KEY}
        APP_DEBUG: ${APP_DEBUG}
        APP_ENV: ${APP_ENV}
        DB_CONNECTION: ${DB_CONNECTION}
        DB_HOST: ${DB_HOST}
        DB_PORT: ${DB_PORT}
        DB_DATABASE: ${DB_DATABASE}
        DB_USERNAME: ${DB_USERNAME}
        DB_PASSWORD: ${DB_PASSWORD}
        SESSION_DRIVER: ${SESSION_DRIVER}
        SESSION_LIFETIME: ${SESSION_LIFETIME}
        SESSION_ENCRYPT: ${SESSION_ENCRYPT}
        SESSION_PATH: ${SESSION_PATH}
        SESSION_DOMAIN: ${SESSION_DOMAIN}
        BROADCAST_CONNECTION: ${BROADCAST_CONNECTION}
        FILESYSTEM_DISK: ${FILESYSTEM_DISK}
        QUEUE_CONNECTION: ${QUEUE_CONNECTION}

        x-database-environment: &databaseEnvironment
        MYSQL_DATABASE: ${DB_DATABASE}
        MYSQL_USER: ${DB_USERNAME}
        MYSQL_PASSWORD: ${DB_PASSWORD}
        MYSQL_ROOT_PASSWORD: ${DB_PASSWORD}
        SERVICE_TAGS: dev
        SERVICE_NAME: mysql

    networks:
        cicd:

    volumes:
        db_data:
            driver: local
        grafana_data:
            driver: local

    services:
        mysql:
            image: mariadb:10.6
            restart: unless-stopped
            tty: true
            ports:
            - "3307:3306"
            healthcheck:
            test: ["CMD", "mysqladmin", "ping", "-h", "localhost"]
            interval: 10s
            timeout: 10s
            retries: 3
            environment:
            <<: [*databaseEnvironment]
            volumes:
            - db_data:/var/lib/mysql
            networks:
            - cicd

        app:
            build:
            context: .
            dockerfile: php.dockerfile
            ports:
            - "80:80"
            volumes:
            - ./src:/var/www/html:delegated
            networks:
            - cicd
            depends_on:
            mysql:
                condition: service_healthy
            environment:
            <<: [*appEnvironment]

        # Prometheus service
        prometheus:
            image: prom/prometheus:latest
            container_name: prometheus
            volumes:
            - ./conf/prometheus/prometheus.yml:/etc/prometheus/prometheus.yml
            - ./conf/prometheus/alert.rules.yml:/etc/prometheus/alert.rules.yml
            ports:
            - "9090:9090" # Expose Prometheus on port 9090
            networks:
            - cicd

        # Grafana service
        grafana:
            image: grafana/grafana:latest
            container_name: grafana
            environment:
            - GF_SECURITY_ADMIN_PASSWORD=admin
            ports:
            - "3000:3000" # Expose Grafana on port 3000
            networks:
            - cicd
            volumes:
            - grafana_data

        # Node Exporter service
        node-exporter:
            image: prom/node-exporter:latest
            container_name: node-exporter
            ports:
            - "9100:9100" # Expose Node Exporter on port 9100
            networks:
            - cicd

        # Blackbox Exporter service
        blackbox-exporter:
            image: prom/blackbox-exporter:latest
            container_name: blackbox-exporter
            ports:
            - "9115:9115" # Expose Blackbox Exporter on port 9115
            networks:
            - cicd

        alertmanager:
            image: prom/alertmanager:latest
            container_name: alertmanager
            volumes:
            - ./conf/prometheus/alertmanager.yml:/etc/alertmanager/alertmanager.yml
            command:
            - "--config.file=/etc/alertmanager/alertmanager.yml"
            ports:
            - 9093:9093
            networks:
            - cicd
Configure Prometheus
Configure Prometheus to scrape metrics from Node Exporter, Blackbox Exporter, and itself. I have placed a prometheus.yml configuration file file under conf/prometheus folder.
                # prometheus/prometheus.yml
    global:
        scrape_interval: 15s # How often to scrape targets
        evaluation_interval: 15s # How often to evaluate rules

    rule_files:
        - /etc/prometheus/alert.rules.yml # Path to alert rules

    alerting:
        alertmanagers:
        - static_configs:
            - targets: ["alertmanager:9093"]

    scrape_configs:
        # Scrape the Prometheus itself
        - job_name: "prometheus"
        static_configs:
            - targets: ["prometheus:9090"]

        # Scrape Node Exporter (System Metrics)
        - job_name: "node-exporter"
        static_configs:
            - targets: ["node-exporter:9100"]

        # Scrape Blackbox Exporter (API Monitoring)
        - job_name: "blackbox"
        metrics_path: /probe
        params:
            module: [http_2xx] # Monitor HTTP status codes 200-299
        static_configs:
            - targets:
                # Replace with your API URL
                - http://app:80/up
        relabel_configs:
            - source_labels: [__address__]
            target_label: __param_target
            - source_labels: [__param_target]
            target_label: instance
            - target_label: __address__
            replacement: blackbox-exporter:9115 # Blackbox Exporter target
Here:
- Node Exporter scrapes system metrics.
- Blackbox Exporter monitors the health of the Laravel app by checking the /health endpoint.
- Prometheus scrapes itself to monitor its own performance.
Configure Alertmanager
Now, let's configure Alertmanager to handle alerts and send notifications to a specified channel (e.g., email or Slack). I have created an alertmanager.ymlfile inside the conf/prometheus folder.
  global:
    resolve_timeout: 5m # How long to wait before resolving an alert

  route:
    receiver: "email_notifications"
    group_wait: 30s
    group_interval: 5m
    repeat_interval: 3h

  receivers:
    - name: "email_notifications"
      email_configs:
        - to: "TO_ADDRESS"
          from: "FROM_ADDRESS"
          smarthost: "MAIL_HOST"
          auth_username: "MAIL_USERNAME"
          auth_password: "MAIL_PASSWORD"
          require_tls: false #Use this for local development
Add Alert Rules for Prometheus
Define alert rules for Prometheus. For example, if CPU usage goes above 90%, or if the Laravel app's health endpoint is unreachable. Create an alert.rules.yml file inside the conf/prometheusfolder.
  groups:
    - name: node_exporter_alerts
      rules:
        # Alert for High CPU Usage
        - alert: HighCPUUsage
          expr: 100 - (avg by (instance) (rate(node_cpu_seconds_total{mode="idle"}[5m])) * 100) > 90
          for: 5m
          labels:
            severity: warning
          annotations:
            summary: "High CPU usage on {{ $labels.instance }}"
            description: "CPU usage has been over 90% for more than 5 minutes."

        # Alert for Low Available Memory
        - alert: LowMemory
          expr: (node_memory_MemAvailable_bytes / node_memory_MemTotal_bytes) * 100 < 10
          for: 5m
          labels:
            severity: critical
          annotations:
            summary: "Low memory available on {{ $labels.instance }}"
            description: "Less than 10% of memory available for more than 5 minutes."

    - name: blackbox_exporter_alerts
      rules:
        # Alert for API Unavailability
        - alert: APIEndpointDown
          expr: probe_success == 0
          for: 1m
          labels:
            severity: critical
          annotations:
            summary: "API Endpoint Down"
            description: "The API endpoint at {{ $labels.instance }} is down."

        # Alert for High Response Time
        - alert: HighResponseTime
          expr: probe_duration_seconds > 5
          for: 5m
          labels:
            severity: warning
          annotations:
            summary: "High Response Time for {{ $labels.instance }}"
            description: "The response time for {{ $labels.instance }} has been greater than 1 second for more than 5 minutes."
Start the Stack
Now that the configuration is done, you can bring up the services using Docker Compose. Below command will launch Prometheus, Node Exporter, Blackbox Exporter, Grafana, and Alertmanager.
docker compose up -d
List of services:
- Laravel app will run on http://localhost
- Prometheus will run on http://localhost:9090
- Grafana will run on http://localhost:3000
- Alertmanager will run on http://localhost:9093
- Node exporter will run on http://localhost:9100
- Blackbox exporter will run on http://localhost:9115


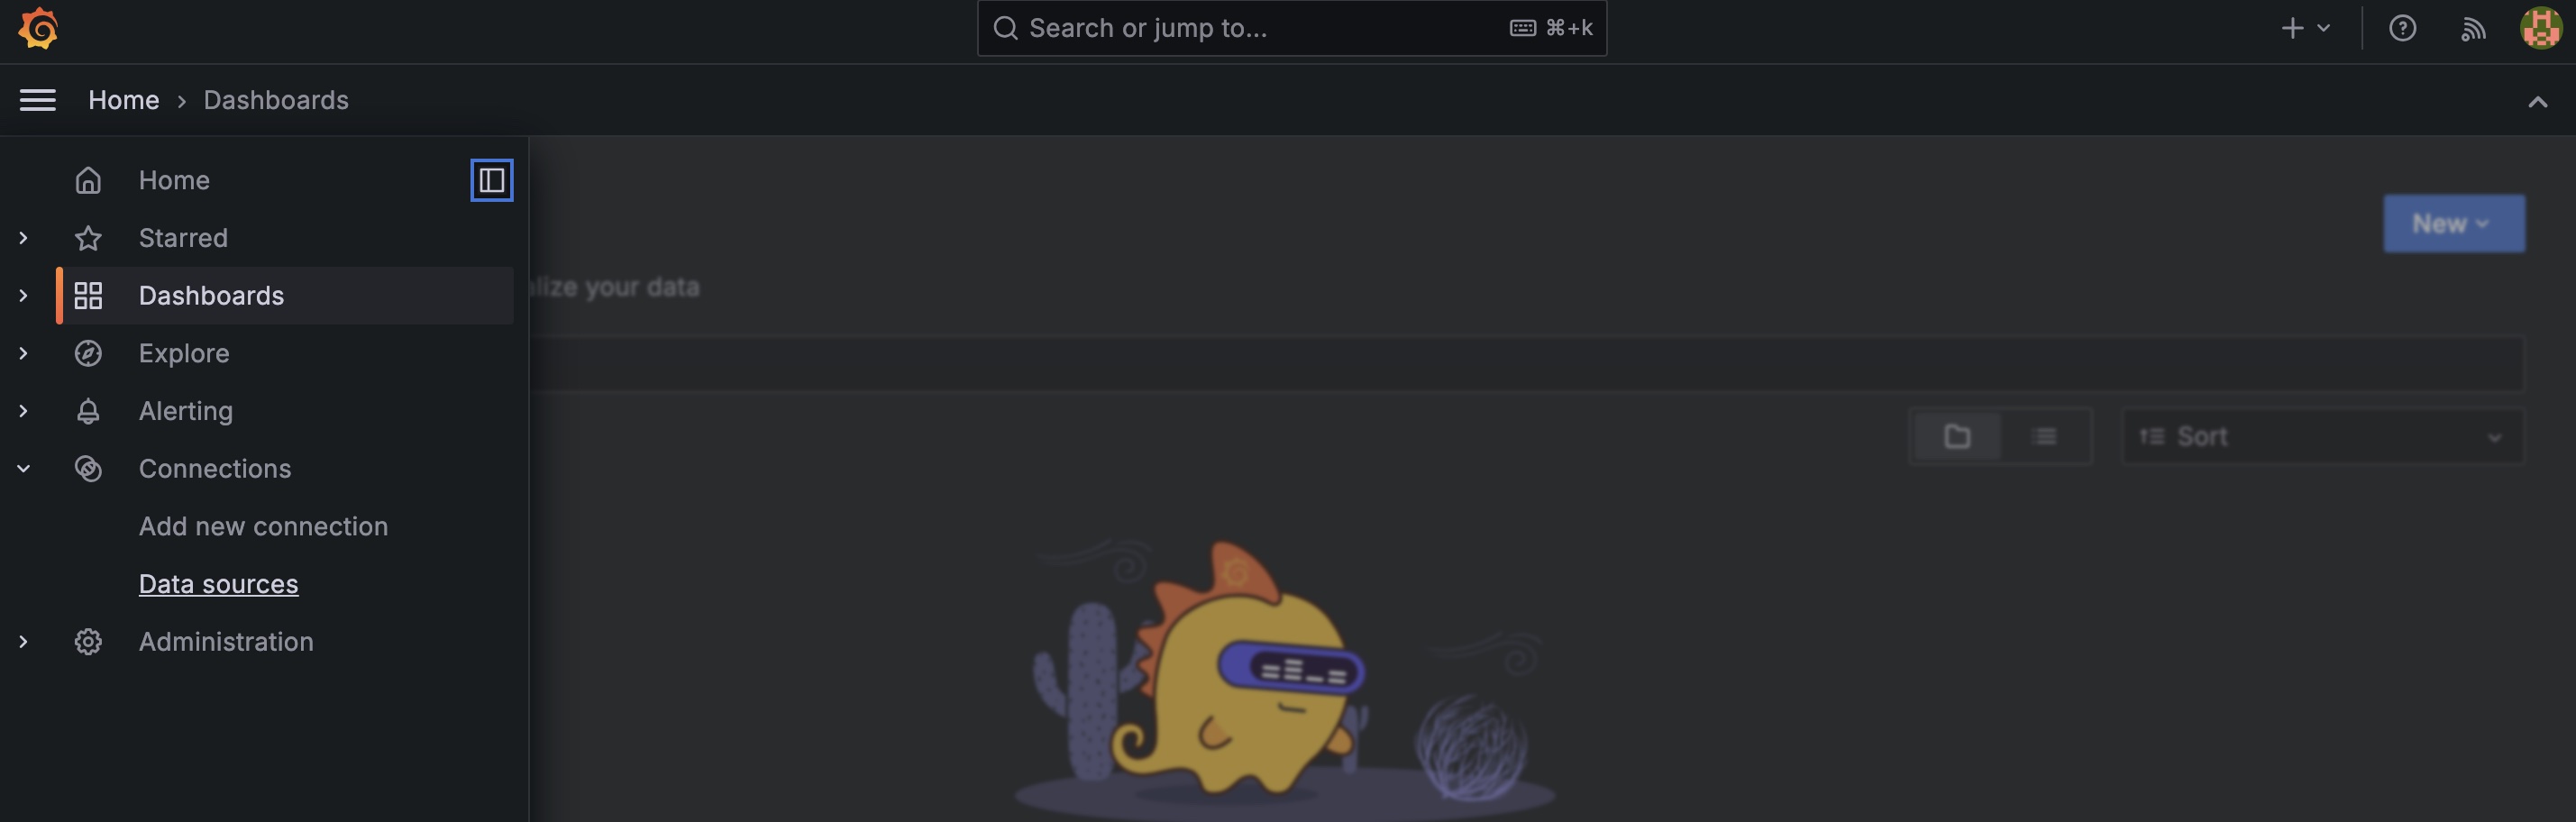
Configure Grafana Dashboards
-
Open Grafana at http://localhost:3000 and log in with the
credentials (default admin/admin).

-
Add Prometheus as a data source:
-
Navigate to Configuration > Data Sources.
-
Add a new data source and choose Prometheus.

- Set the URL to http://prometheus:9090 and click save button at the bottom.
-
Navigate to Configuration > Data Sources.
-
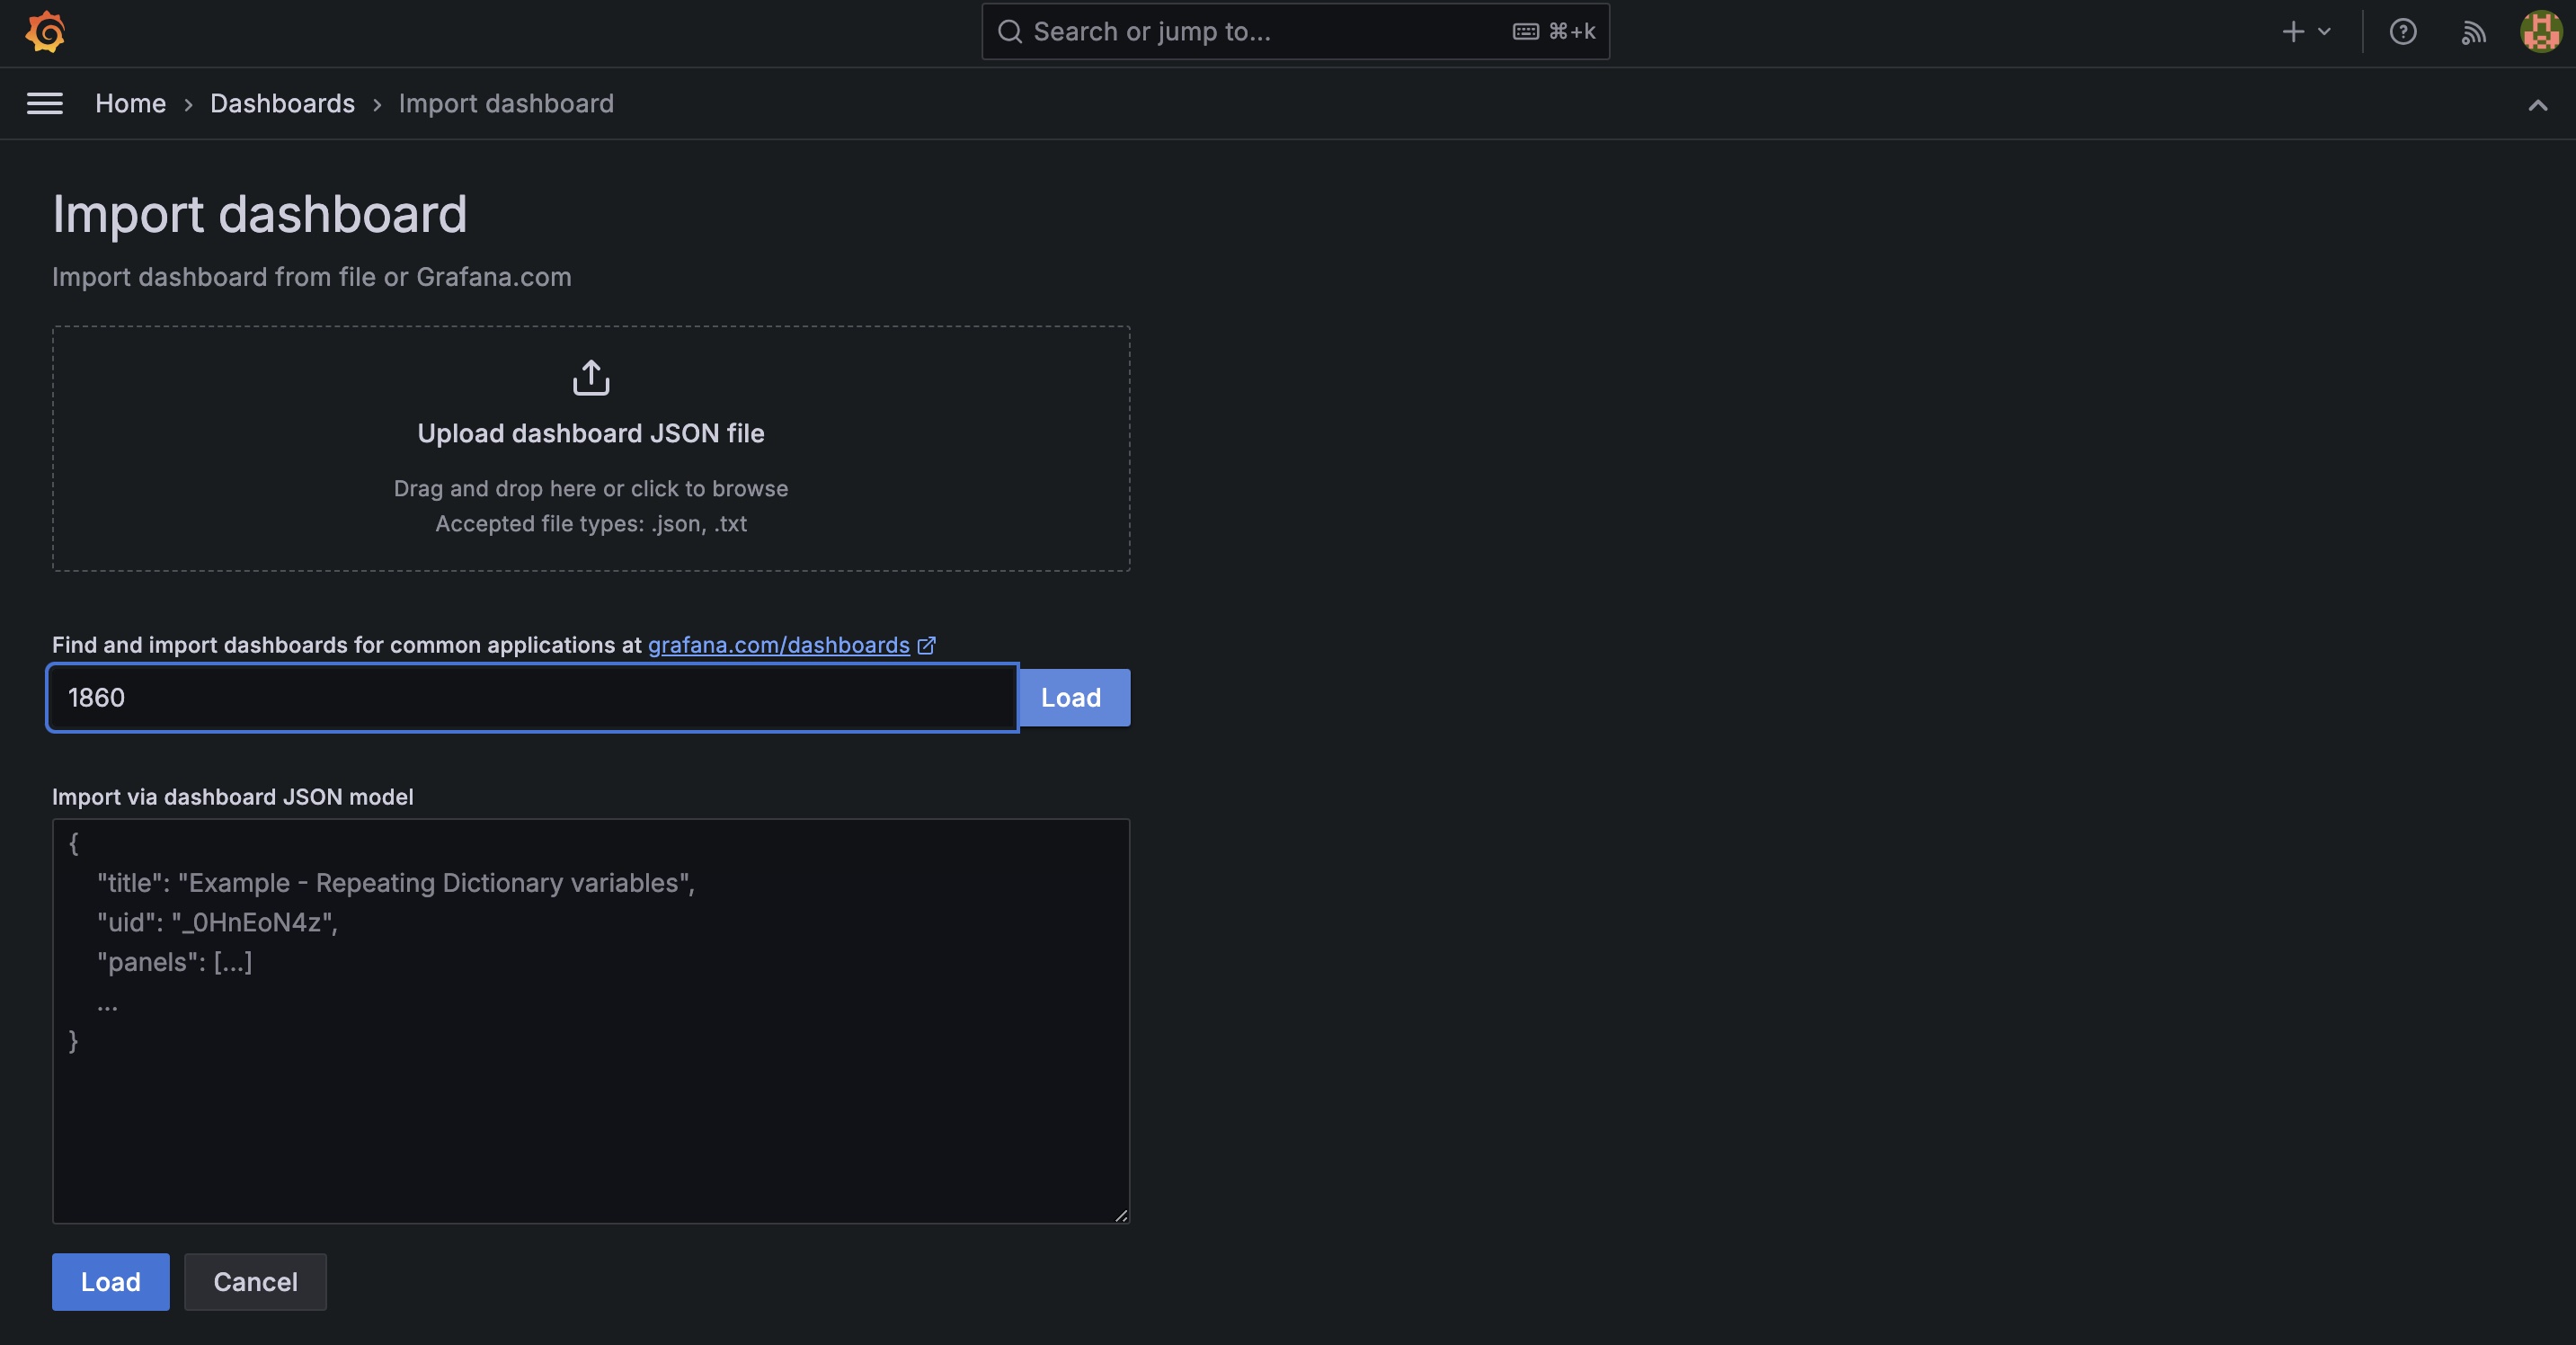
Import pre-built dashboards for Node Exporter:
-
Go to Create > Import and use Dashboard ID 1860 for Node
Exporter metrics.

-
Go to Create > Import and use Dashboard ID 1860 for Node
Exporter metrics.
-
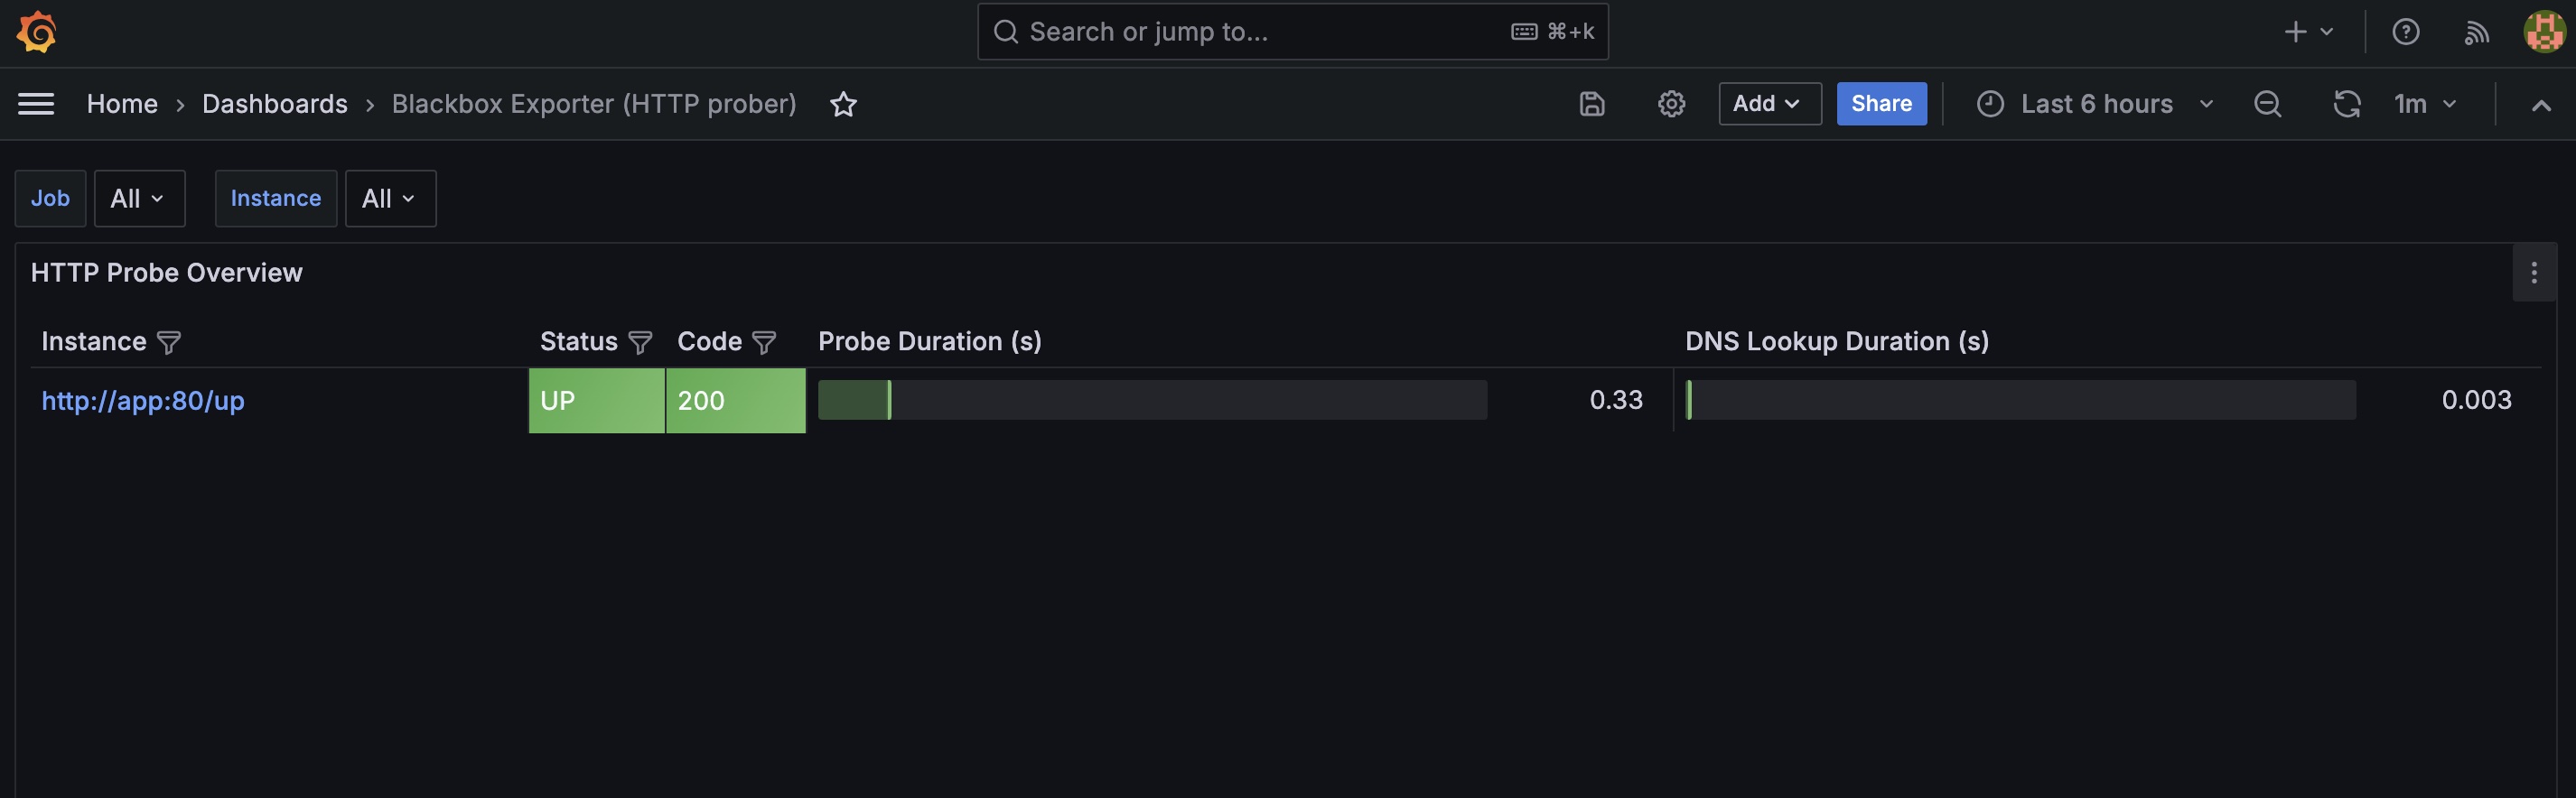
Create a custom dashboard to visualize your Laravel app's health
endpoint using data from Blackbox Exporter.

Verify Alerts
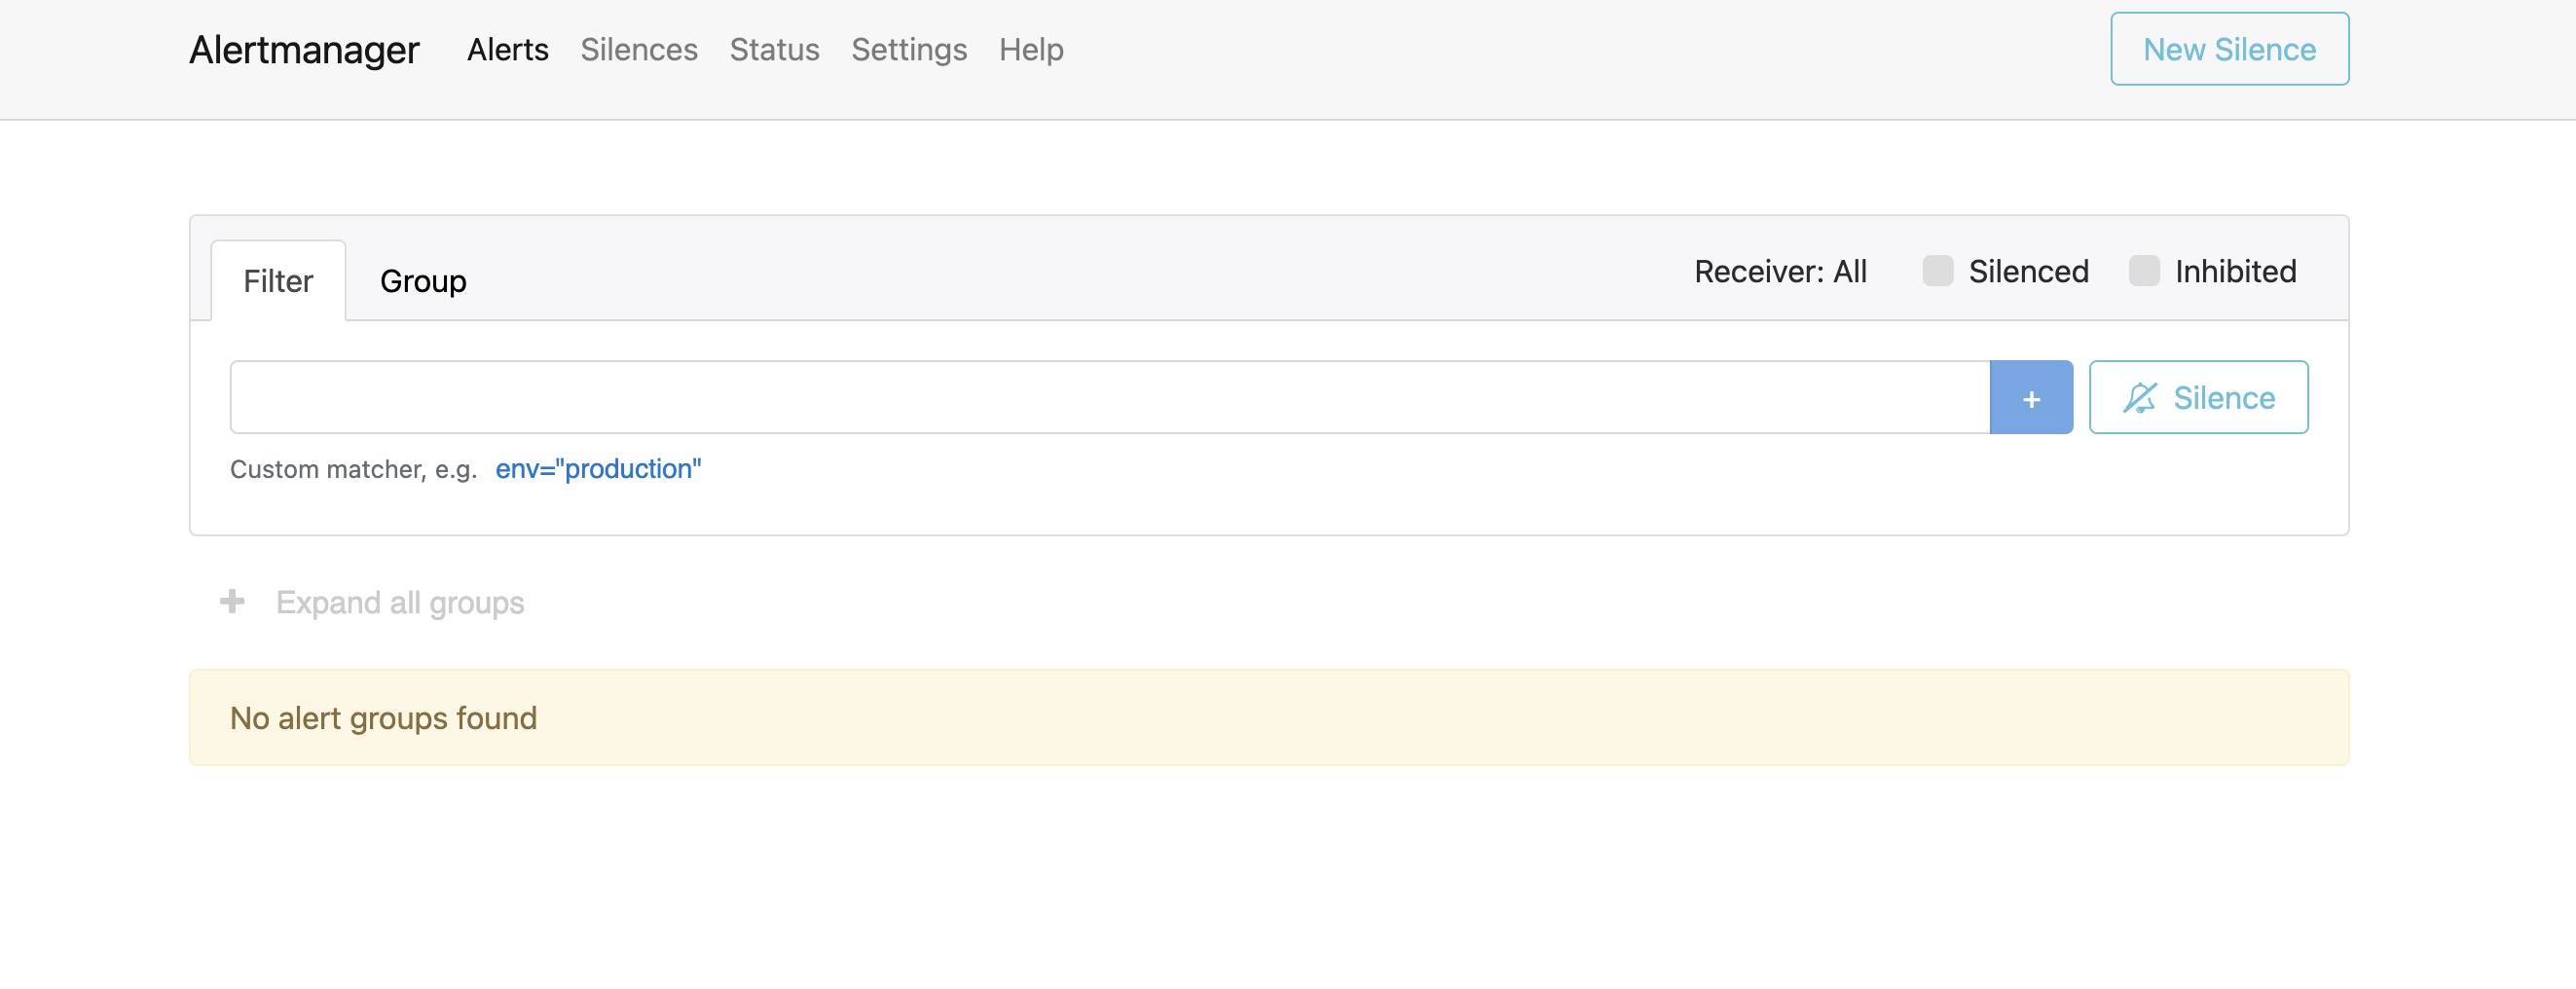
You can check active alerts in the Prometheus UI at
http://localhost:9090/alerts.
Test the alerts by:
- Simulating high CPU usage or resource exhaustion on the server.
- Bringing down the Laravel application to test the downtime alert.
You should receive an email (or notification on your preferred platform) when the alerts are triggered.
Bring down the Laravel application using below command. Once the application is down you should receive an email notification.
  # This will bring laravel application into maintenance mode
  docker compose exec app php artisan down


Conclusion
By setting up Prometheus, Node Exporter, Blackbox Exporter, Grafana, and Alertmanager, you now have a powerful monitoring system for your Laravel application and server infrastructure. This stack will help you proactively monitor resource usage, performance issues, and application availability, while providing real-time alerts and insightful visualizations for better decision-making.
This setup is highly extensible, and you can continue to add more exporters (e.g., database exporters, Redis exporters) or set up additional alerts as your application grows.
For questions and queries please reach via below email